
Node-RED Remote Monitoring for Distributed Sites: Why Robustel EG5120 Fits
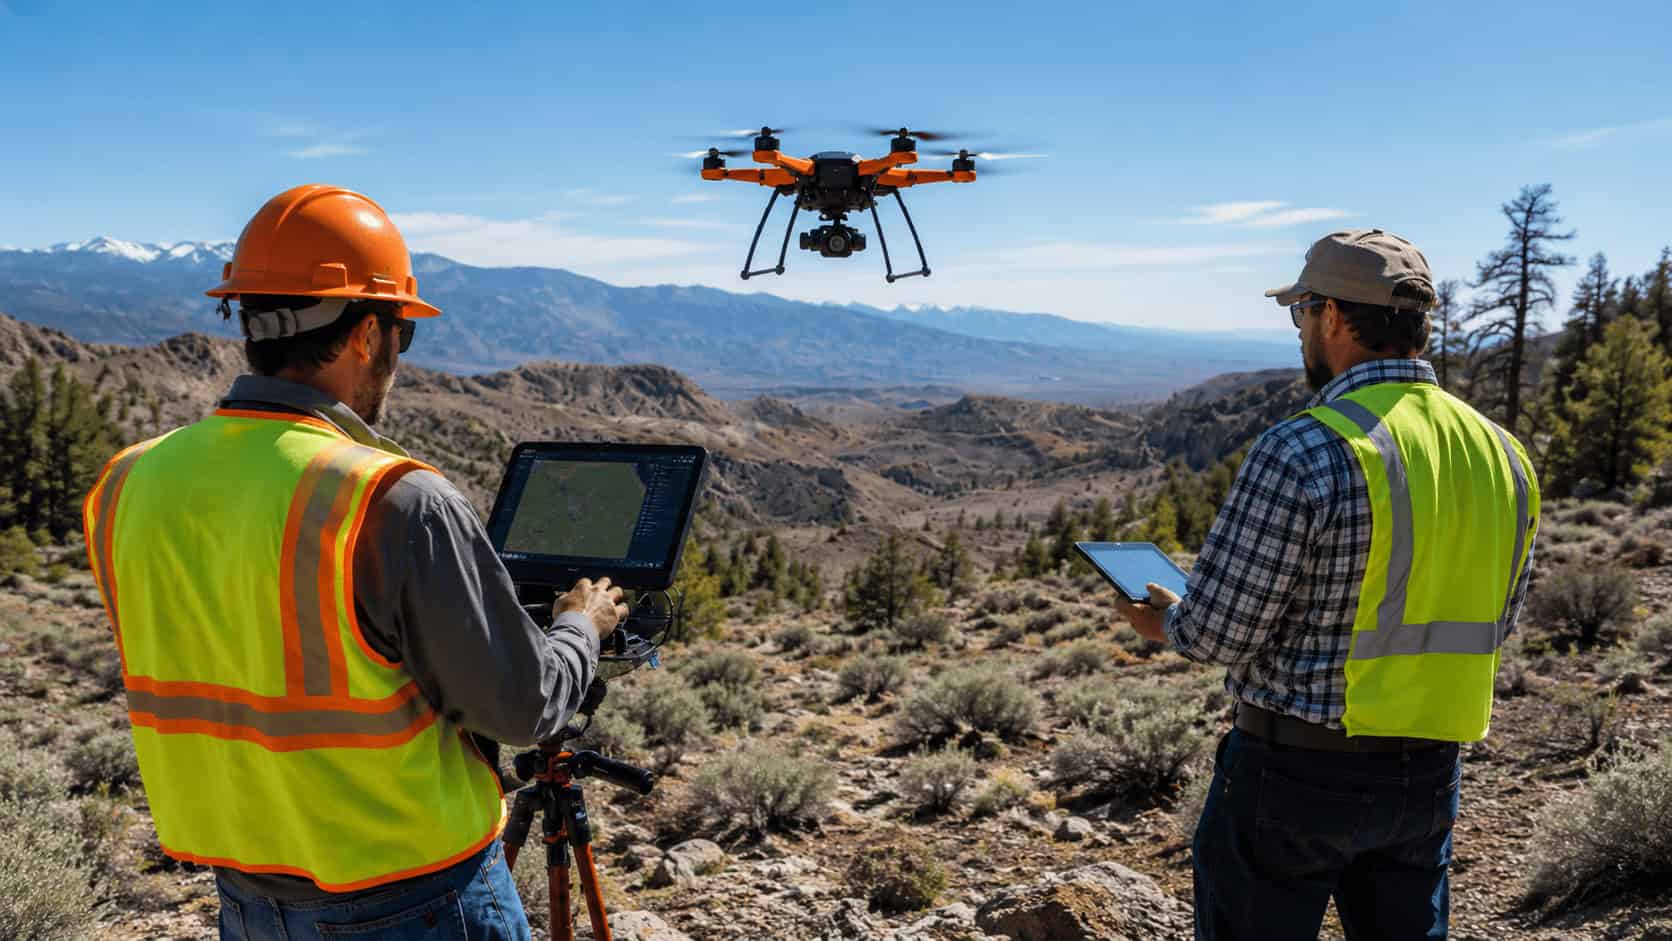
Robustel EG5120 is a strong fit for Node-RED remote monitoring because it combines Docker-based edge application support, Modbus TCP/RTU connectivity, MQTT-to-cloud bridging, cellular or Ethernet backhaul, and RCMS remote management in a single industrial edge gateway. Distributed monitoring projects become easier to manage when Node-RED prepares structured field data and Robustel EG5120 provides the gateway foundation for secure edge-to-dashboard workflows.
Node-RED remote monitoring helps distributed sites turn selected field values into dashboard-ready messages before data leaves the edge. The best-fit workflow has 4 steps: collect values, add context, publish structured data, and validate data quality.
Remote monitoring should not start with dashboard layout. It should start with 5 field decisions: which values matter, how often they change, what context they need, where they are published, and how bad or stale data is flagged.
The main boundary is clear: Node-RED can support field data collection, formatting, and forwarding, while Robustel EG5120 provides the site-side gateway layer. Dashboard behavior, cloud analytics, alerting, and visualization features still depend on the selected platform and project configuration.
Why Remote Monitoring Fails When Field Data Arrives Without Context
Remote monitoring projects often begin with a simple goal: make field equipment visible from another location. The problem is that raw values alone rarely create useful visibility.
A pressure value, relay state, energy reading, or run signal only becomes useful when the message explains where it came from, what it means, when it was collected, and whether the value is still valid.
A better conclusion is this: remote monitoring needs dashboard-ready data, not just field data. The edge workflow should prepare selected values before sending them to dashboards, databases, brokers, or cloud platforms.
Define the monitoring question before building the flow
A remote monitoring flow should start with the operating question. A pump site, cabinet, energy asset, or machine cell may expose many signals, but only some values help remote teams make decisions.
A practical first version may focus on 10–20 values per site. These may include run status, fault status, energy use, pressure, temperature, communication state, or door/cabinet status.
The goal is not to collect everything. The goal is to make a small number of field values useful enough for remote diagnostics, trend review, maintenance planning, or service prioritization.
Convert raw values into dashboard fields
A dashboard field should usually include at least 6 items: site ID, asset ID, tag name, value, timestamp, and quality status. Without these fields, the receiving platform may display data but still lack operational meaning.
| Dashboard-ready field | Por qué es importante |
| site_id | Identifies the remote location |
| asset_id | Links the value to equipment |
| tag_name | Gives the value a readable meaning |
| value | Carries the measurement or state |
| timestamp | Shows when the data was collected |
| quality | Flags good, stale, bad, or uncertain data |
This structure keeps the article focused on the real pain point: remote monitoring is not only about sending data from field sites. It is about sending data that a remote user can understand.
From Field Signals to Dashboard-Ready Messages
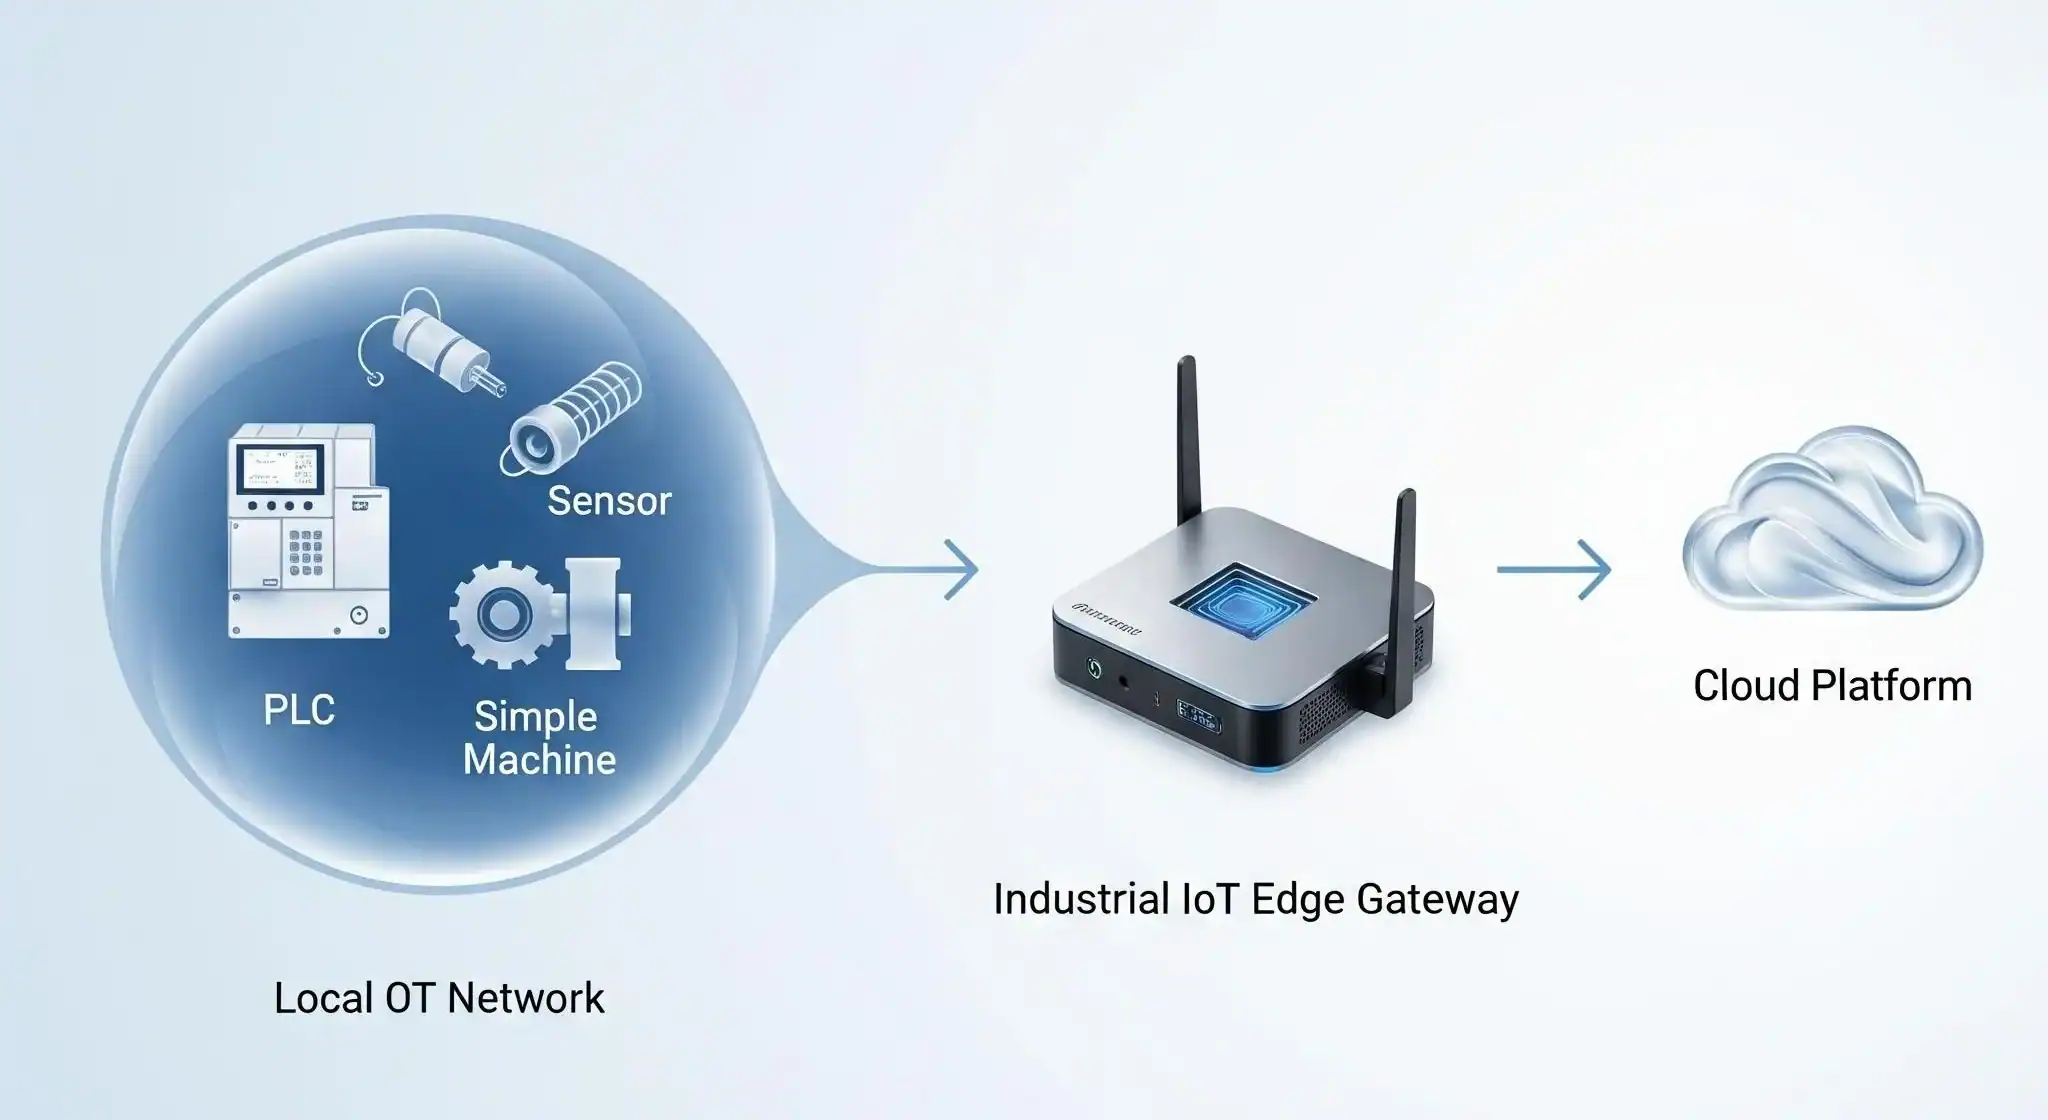
Node-RED fits as the flow layer between field-side values and upper-layer monitoring systems. It can help collect selected inputs, map field values, add context, and publish structured data to MQTT, HTTP, databases, or other configured endpoints.
This role should be described carefully. Node-RED is useful for building data flows, but it does not automatically understand every device, every protocol, or every dashboard. The engineering team still needs the device manual, data map, installed nodes, credentials, and test plan.
From field input to monitoring message
A remote monitoring flow often has 4 steps. First, the gateway reads data from a field device. Second, Node-RED maps the raw value into a named tag. Third, the flow adds site and asset context. Fourth, the message is published upstream.
| Flow step | Example in remote monitoring |
| 1. Read | Collect selected Modbus, serial, I/O, or local values |
| 2. Map | Convert raw values into readable monitoring tags |
| 3. Context | Add site ID, asset ID, timestamp, and quality |
| 4. Publish | Send structured data to MQTT, HTTP, database, or cloud endpoint |
This workflow is useful because it keeps field-side interpretation close to the equipment. Upper systems can then receive cleaner messages instead of needing to interpret every register, bit, or site-specific signal.
Field protocols and dashboard protocols are not the same layer
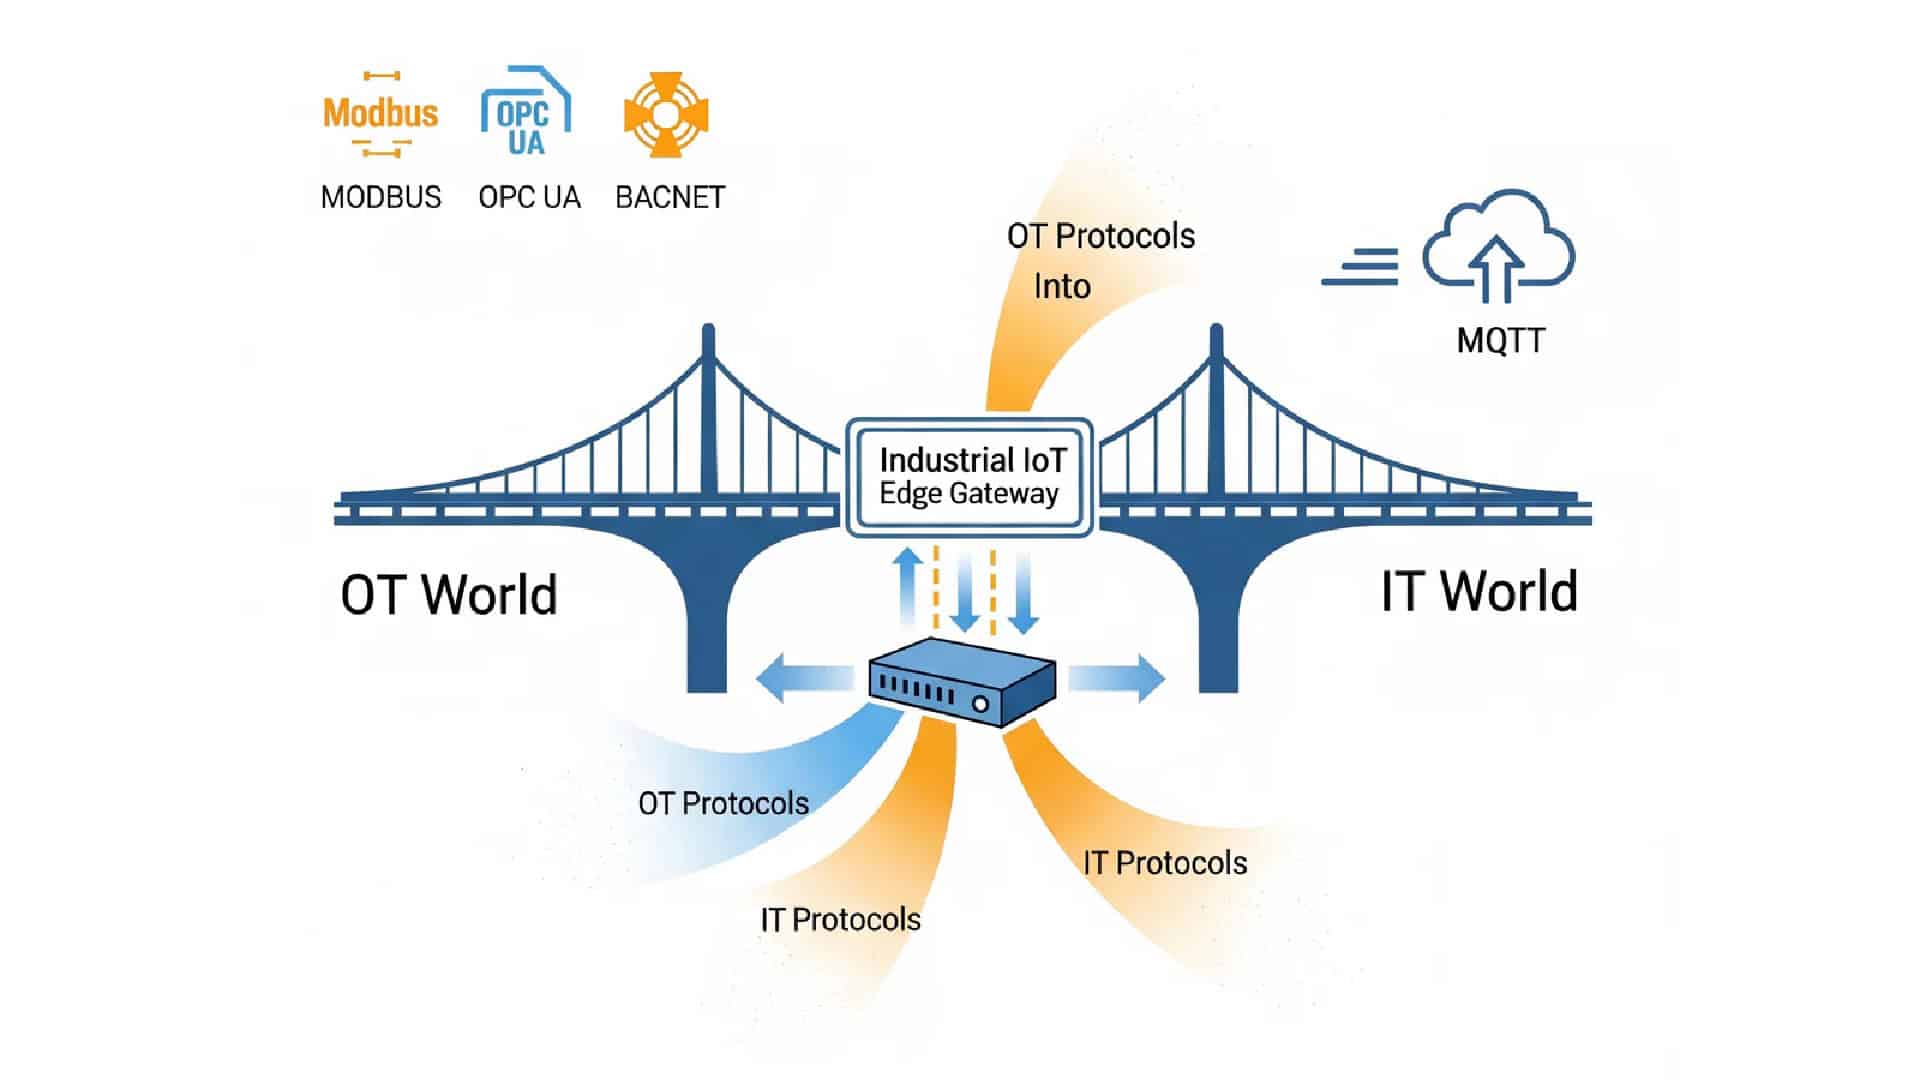
Remote monitoring often crosses an OT-to-IT boundary. Field devices may use Modbus RTU, Modbus TCP, serial communication, digital I/O, or other local interfaces, while dashboards and cloud systems often expect MQTT, HTTP, APIs, or database-ready messages.
That is why the edge gateway needs to do more than forward bytes. It must help translate field-side values into a format that upper systems can consume.
A clean architecture keeps this distinction visible. Field protocols collect equipment-side data; dashboard-facing protocols carry structured messages; Node-RED can help define the transformation layer between them where the required nodes, runtime, and project configuration are available.
Designing Monitoring Data Before Choosing Dashboard Widgets
A remote monitoring dashboard should not be treated as a magic layer that fixes poor data design. If values arrive without names, units, timestamps, or quality flags, the dashboard may show numbers without giving operators reliable context.
The safe approach is to design the edge payload first. The dashboard or cloud platform can then use the prepared fields according to its own capabilities.
Separate live status, alarms, and slow trends
Not every value needs the same update pattern. Remote monitoring data can usually be grouped into 3 categories: live status, alarm or event data, and slow trend data.
Live status may include run/stop state or connectivity state. Alarm data may be sent when a fault or threshold occurs. Slow trend data may include temperature, energy, pressure, or accumulated counters.
This classification helps avoid unnecessary traffic. A remote monitoring flow should not publish every value at the fastest possible interval. It should publish values according to their operational purpose.
Build messages that can survive platform changes
A good edge message should remain understandable even if the dashboard or cloud platform changes later. That means the payload should carry its own meaning instead of relying only on platform-side configuration.
A practical message may include tag name, value, unit, timestamp, quality, site ID, asset ID, and source. These fields make the data easier to route, store, compare, and troubleshoot.
| Payload field | Example purpose |
| tag | Human-readable monitoring variable |
| value | Current reading or state |
| unit | Engineering unit or state category |
| timestamp | Collection time |
| quality | Good, stale, bad, or uncertain |
| site | Remote site identifier |
| asset | Equipment or cabinet identifier |
| source | Device, interface, or register reference |
The conclusion is practical: Node-RED can help shape field data into useful monitoring messages, but the project still needs a clear data model before choosing dashboard widgets or cloud-side rules.
Robustel EG5120 Edge Gateway for Remote-Site Data Preparation and Backhaul
Robustel EG5120 edge computing gateway is a suitable product reference because remote monitoring needs an industrial host, not only a low-code editor. EG5120 is a 5G-ready industrial edge gateway built on RobustOS Pro based on Debian 11, with Docker containers and Debian packages for protocol bridges, data buffering, and edge workloads.
The same product context makes EG5120 relevant for distributed monitoring sites: dual-SIM 5G/4G/3G/2G and Ethernet WAN with link backup, 2× software-configurable RS-232/RS-485 ports, 2× DI/2× DO, native Modbus TCP/RTU, MQTT-to-cloud bridging, VPN options, and RCMS for monitoring, configuration, and updates.
Gateway requirements for remote monitoring data flows
| Remote monitoring need | Robustel EG5120 reference |
| Connect field devices | 2× software-configurable RS-232/RS-485, 2× DI/2× DO |
| Read industrial data | Native Modbus TCP/RTU support |
| Run Node-RED or edge apps | RobustOS Pro, Debian 11, Docker containers |
| Forward dashboard data | MQTT-to-cloud bridging and IP networking |
| Support remote sites | Dual-SIM 5G/4G/3G/2G and Ethernet WAN link backup |
| Secure connectivity | IPsec, OpenVPN, GRE, L2TP, PPTP, DMVPN |
| Manage deployed gateways | RCMS monitoring, configuration, and updates |
This table should be read as a product-fit reference, not a guarantee that every dashboard, cloud, or Node-RED node is supported by default. Final capability still depends on firmware, installed packages, credentials, network policy, and project validation.
Why remote monitoring needs a managed gateway
Remote monitoring projects are usually long-lived. A gateway may sit in a cabinet, station, utility site, or remote equipment room for years. If the flow, credentials, firmware, or network settings cannot be maintained remotely, the monitoring system becomes harder to trust.
This is why gateway management matters. The edge device should support not only data collection, but also configuration review, update planning, diagnostics, and controlled access.
Robustel EG5120 and RCMS fit this part of the architecture because remote monitoring does not stop once values appear on a dashboard. The gateway must remain configurable, visible, and maintainable across the device lifecycle.
Runtime and Data-Quality Checks Before Dashboard Use
A Node-RED remote monitoring flow should not move to production only because the first dashboard displays values. The team should test how the flow behaves when the gateway reboots, the WAN link drops, the MQTT broker is unavailable, or a field device stops responding.
A minimum validation plan should include 6 tests: normal data collection, field-device communication loss, gateway reboot, MQTT broker outage, WAN recovery, and stale-data handling. These tests show whether the dashboard loses data clearly or continues displaying values that are no longer trustworthy.
Validate the Node-RED runtime on the edge gateway
For EG Series deployments, Node-RED runtime checks should include Docker status, port exposure, editor access, container restart behavior, and user permissions.
Robustel’s Knowledge Base how-to article on installing Node-RED on EG Series gateways via Docker is a useful implementation reference for validating port 1880 mapping, container status checks, browser access, and basic troubleshoot.
The key point is not the installation command itself. For remote monitoring, the important question is whether the Node-RED runtime can recover predictably, remain secure, and stay maintainable after the site is no longer physically convenient to access.
Test MQTT broker behavior before sending data upstream
If the project uses a local MQTT broker during testing, the broker should be validated before dashboard data is trusted. The team should confirm service status, local publish/subscribe behavior, LAN client access, topic structure, and what happens when the broker becomes unavailable.
Robustel’s Knowledge Base how-to article on installing the MQTT broker service on EG Series devices is useful for Mosquitto setup, local publish/subscribe testing, and LAN client validation during controlled testing.
A testing broker should not be treated as a production security model by default. Anonymous access, simple LAN tests, and local validation steps need to be reviewed against authentication, authorization, ACLs, firewall rules, and VPN policy before deployment.
The key conclusion is simple: a remote monitoring dashboard is only as reliable as the edge runtime and broker path behind it. Node-RED can prepare dashboard-ready data, but production use still requires visible failure states, secure access, and a tested recovery process.
FAQs
Q1. How does Node-RED support remote monitoring?
Node-RED supports remote monitoring by helping teams collect selected field data, map raw values into named tags, add site or asset context, and publish structured messages to upstream systems. It is useful when remote teams need equipment visibility but do not want every dashboard or cloud system to interpret raw field registers directly. The main value is not the dashboard itself, but the edge-side preparation of monitoring data before it leaves the site.
Q2. Can Node-RED build a remote monitoring dashboard?
Node-RED can support dashboard-style visualization where the required nodes, runtime, and project configuration are available, but dashboard behavior should not be overgeneralized. The specific visualization, user management, alerting, storage, and cloud features depend on the selected dashboard or platform. In many industrial projects, Node-RED is best used to prepare and publish structured data, while the final dashboard may run in a cloud platform, SCADA layer, database tool, or separate visualization system.
Q3. Which Robustel gateway fits Node-RED remote monitoring?
Robustel EG5120 edge computing gateway is a suitable reference for Node-RED remote monitoring because it combines RobustOS Pro, Docker containers, 2× RS-232/RS-485, 2× DI/DO, native Modbus TCP/RTU, MQTT-to-cloud bridging, dual-SIM 5G/4G/3G/2G, Ethernet WAN link backup, VPN options, and RCMS remote management. These features make it relevant where remote sites need field data collection, edge-side formatting, secure backhaul, and centralized gateway management.
Q4. What should teams check before sending data to cloud dashboards?
Teams should check at least 6 areas before sending data to cloud dashboards: field data scope, tag naming, timestamp handling, quality status, topic or API structure, and network recovery behavior. They should also test gateway reboot, communication loss, broker outage, and stale-data handling. A dashboard that displays values during commissioning is not enough. The remote monitoring flow should fail visibly, recover predictably, and provide enough context for remote users to trust the data.
Q5. Does Node-RED replace a full remote monitoring platform?
No. Node-RED can help build the edge data flow, but it does not automatically replace a full remote monitoring platform. A platform may still be needed for user access, long-term storage, dashboards, alerts, reports, analytics, device management, or integration with enterprise systems. Node-RED is most useful as the edge-side application layer that collects, transforms, and forwards data. The wider monitoring architecture still depends on platform selection, security policy, and operational ownership.
Scaling Node-RED Remote Monitoring Beyond One Field Site
Robustel EG5120 edge gateway can serve as the site-side edge gateway layer for this type of remote monitoring workflow, combining field interfaces, Docker-based application support, cellular or Ethernet backhaul, VPN options, and RCMS remote management. The Node-RED flow prepares the monitoring data, while the gateway and management process help keep the deployment maintainable.
A Node-RED remote monitoring workflow is usually easiest to validate at one site. The challenge changes when the same flow must run across 20, 100, or more gateways, each with different field devices, network paths, credentials, and maintenance windows.
At fleet scale, remote monitoring becomes an operations question, not only a data-flow question. Teams need to manage flow versions, gateway access, remote updates, credential rotation, backups, failure recovery, and visibility into whether each site is still sending trusted data.
The clearer conclusion is that project teams should separate 2 stages: a single-site monitoring pilot and a fleet-scale remote monitoring architecture. Node-RED can help structure field data for dashboards, but reliable remote monitoring still depends on data quality, gateway management, secure access, and long-term ownership of the flow.
Related Reading on Edge Computing in Industrial IoT:


Acerca del autor
Robert Liao | Technical Support Engineer
Robert is an IoT Technical Support Engineer at Robustel, specializing in industrial networking and edge connectivity. A certified Networking Engineer, Robert focuses on the deployment and troubleshooting of large-scale IIoT infrastructures. His work centers on architecting reliable, scalable system performance for complex industrial applications, bridging the gap between field hardware and cloud-side data management.