Grafana & InfluxDB Tutorial: Real-Time IoT Data Visualization Tools
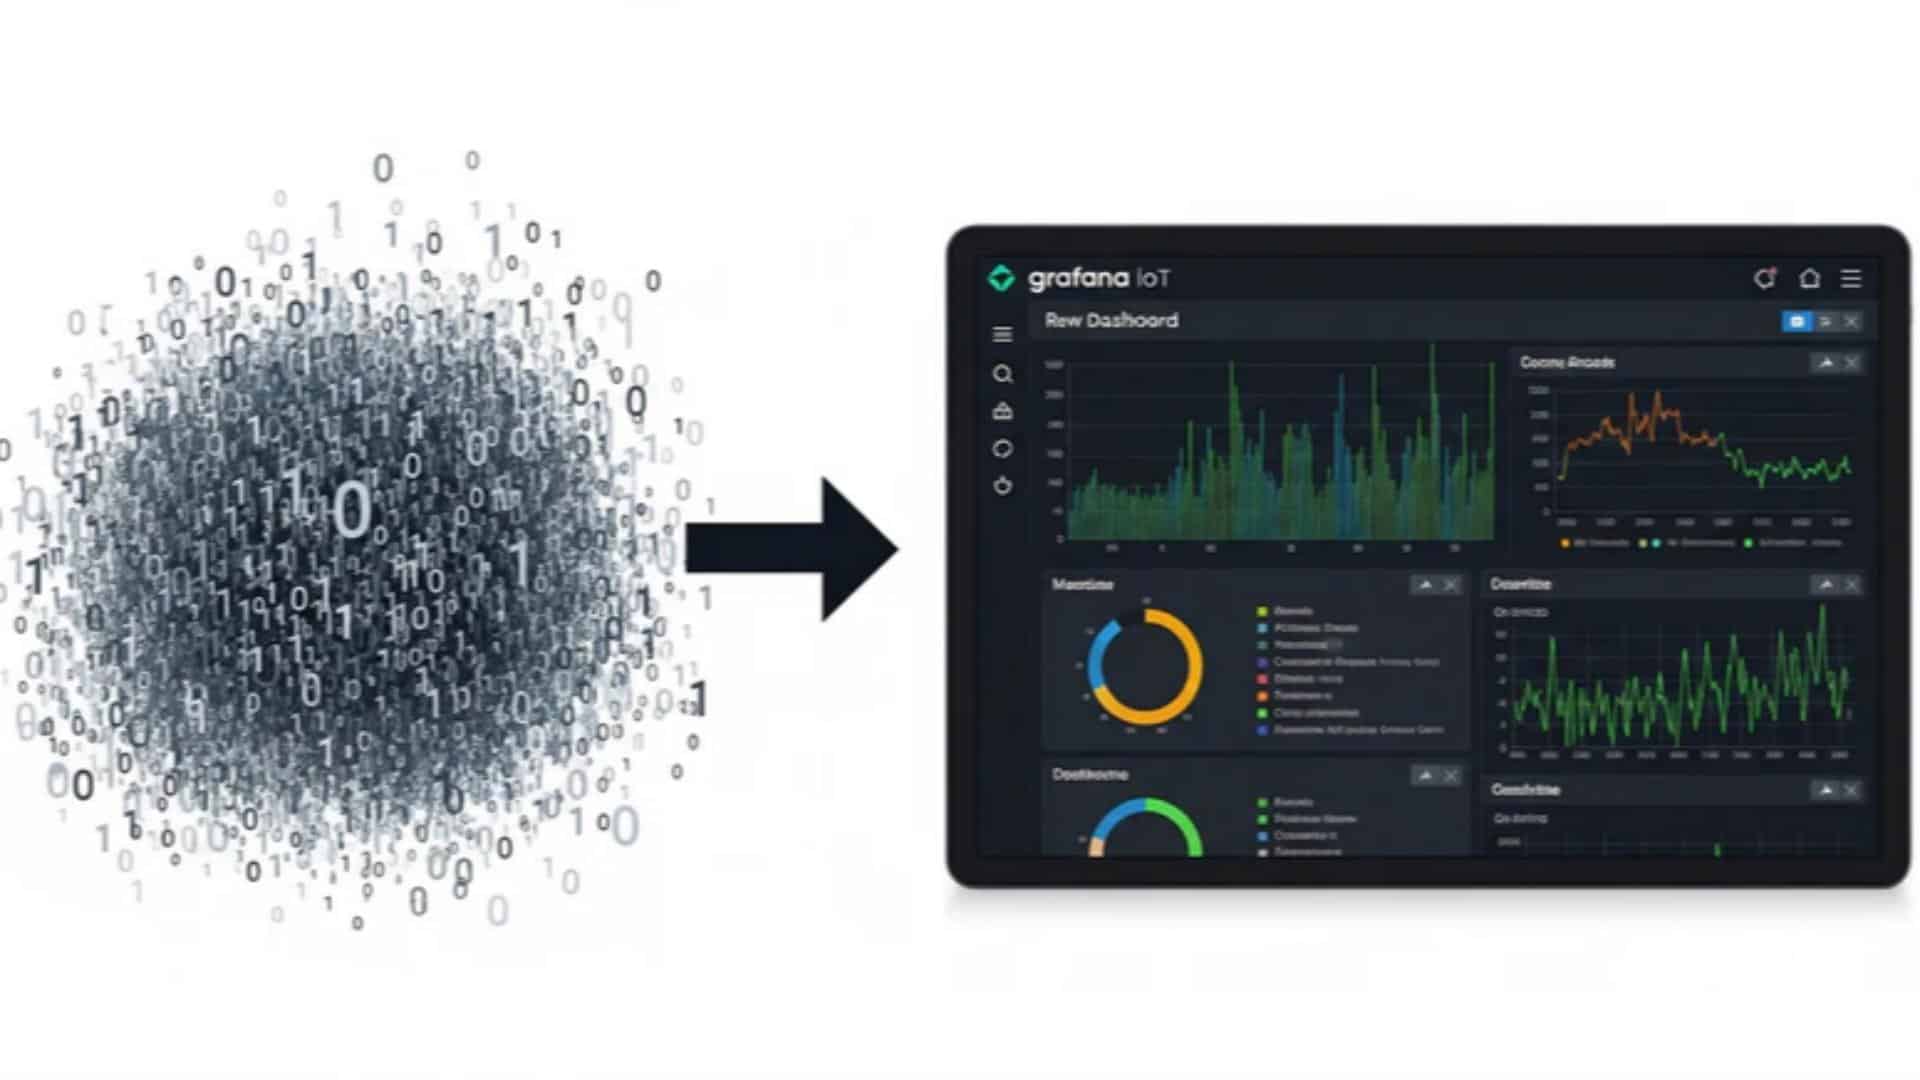
You’ve successfully connected your sensors and are collecting data on your industrial IoT edge gateway—but raw data sitting in a database is useless until you can actually see it. Without a clear interface, that valuable operational data remains locked away.
This guide focuses on that final, crucial step: data visualization. We will provide a practical, step-by-step walkthrough of how to use Grafana to create a compelling, real-time IoT dashboard using sensor data stored in InfluxDB on a Robustel gateway.
Designed for data analysts, operations managers, and technical personnel, this article empowers you to transform raw IIoT data into actionable insights.
Introduction: The Power of Seeing Your Data
I have seen it happen in countless projects: a team spends months engineering a brilliant data collection system, only to have that valuable data sit unused in a database, invisible to the people who need it most. Let’s be clear: if you cannot see your data, you cannot act on it. This is where data visualization becomes the most critical part of your IoT solution.
The good news is that you do not need an expensive, complex cloud platform to create professional-grade dashboards. By running the open-source visualization tool Grafana directly on your Industrial IoT Edge Gateway, you can create a powerful, real-time monitoring solution right at the edge.
In this guide, we will show you exactly how to build your first Grafana IoT Dashboard, turning a stream of raw sensor numbers into a clear, actionable view of your operations.
The Core Components: Grafana and InfluxDB
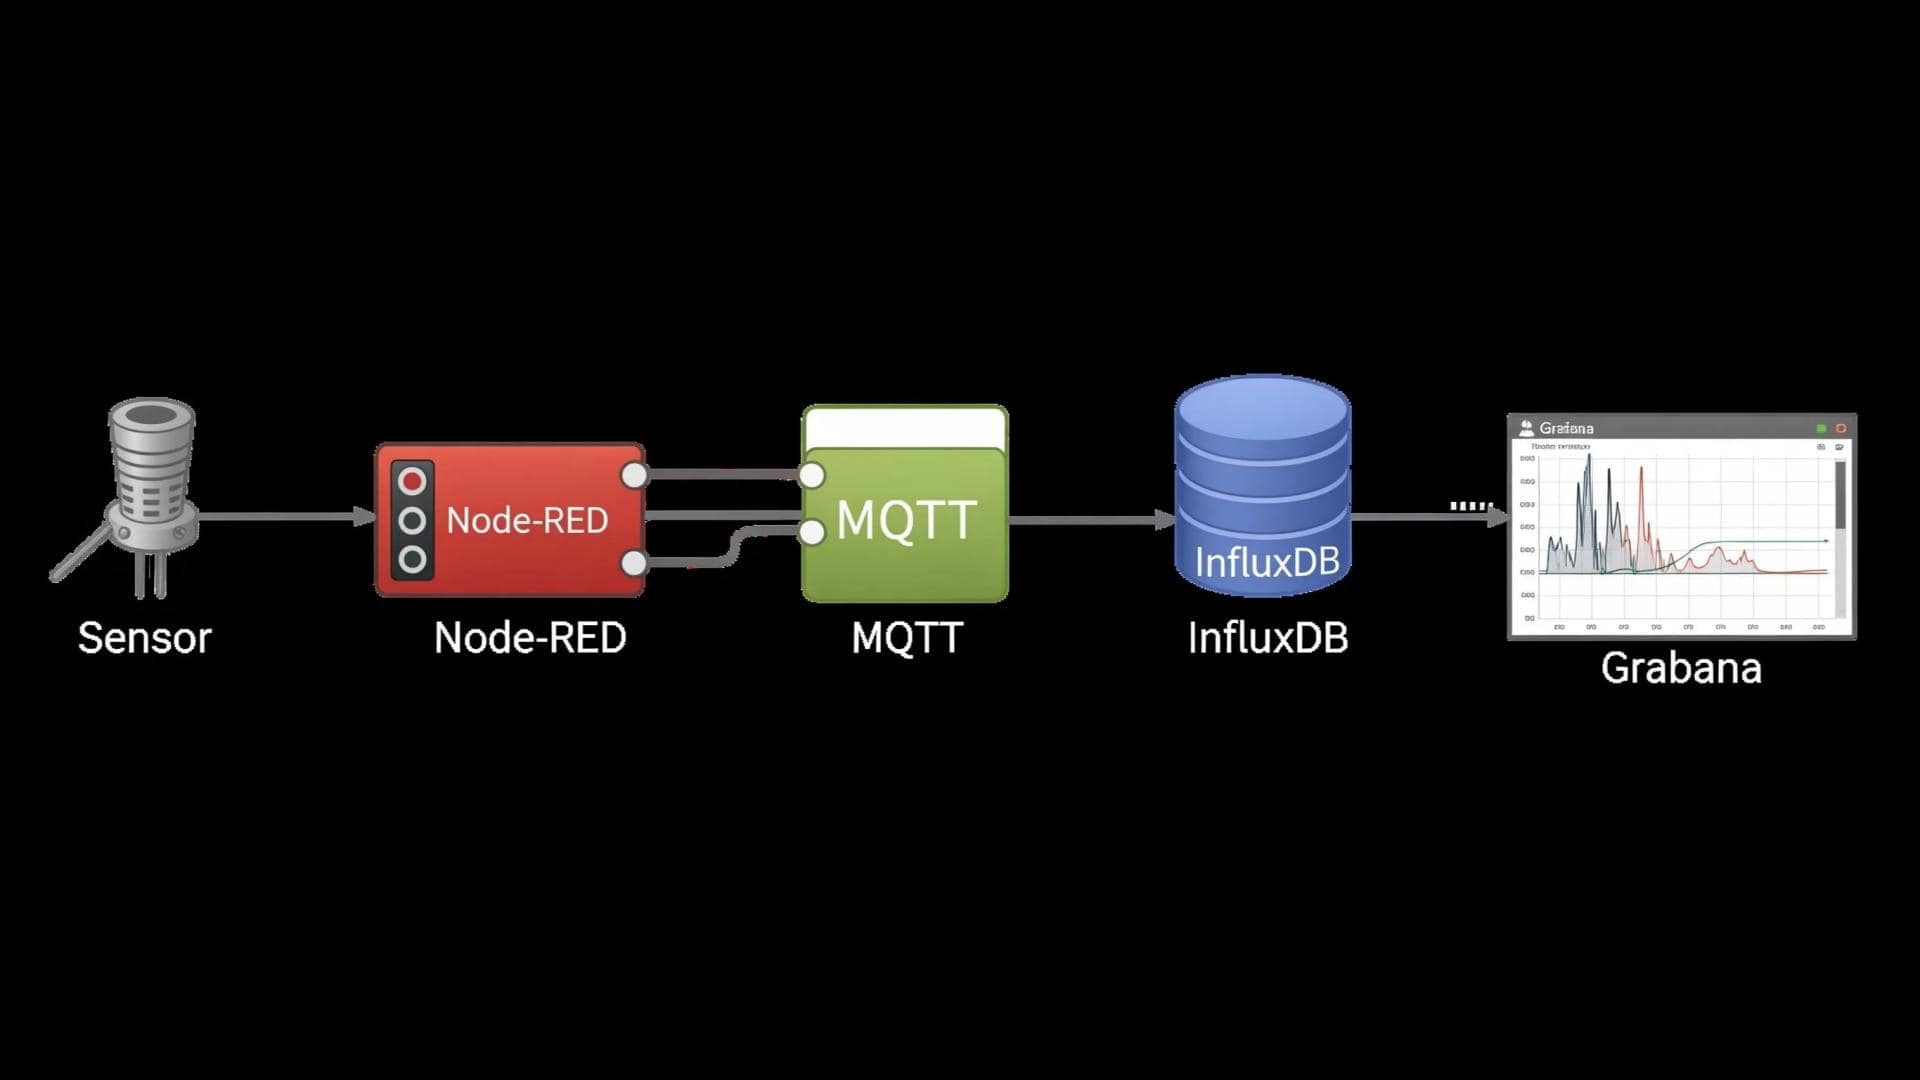
To build our dashboard, we need two key pieces of the “MING” software stack.
● InfluxDB : The Time-Series Database: Think of InfluxDB as the perfect memory for your sensor data. Unlike a general-purpose database, it’s purpose-built to handle massive volumes of timestamped data points, making it incredibly efficient for storing and querying things like temperature, pressure, or vibration over time.
● Grafana: The Visualization Engine: Grafana is the window into your data. It’s a powerful open-source platform that connects to data sources like InfluxDB and allows you to build beautiful, interactive dashboards with graphs, gauges, tables, and alerts. You can learn more at the official Grafana: The open and composable observability platform | Grafana Labs.
Step-by-Step: Setting Up Grafana on Your Robustel Gateway
This guide assumes you have already set up your gateway and are collecting Modbus sensor data using Node-RED and storing it in InfluxDB.
Step 1: Accessing the Visualization Engine
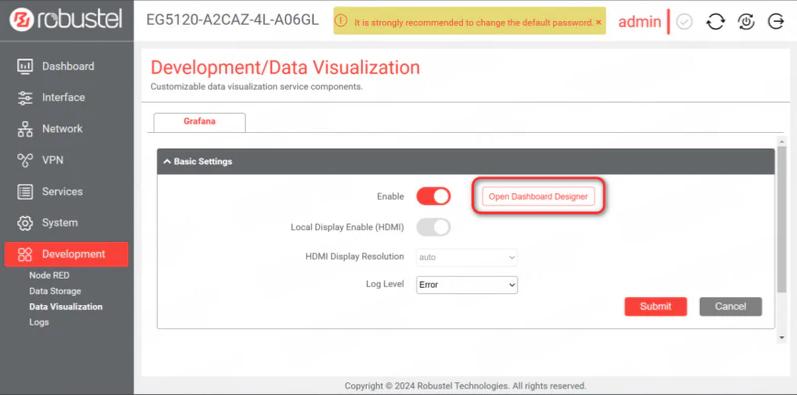
On a Robustel gateway like the EG5120, accessing Grafana is simple:
- Log in to the EG5120’s web interface.
- Navigate to Development -> Data Visualization.
- Ensure Grafana is enabled and click Open Dashboard Designer. This will launch the Grafana interface in a new browser tab.
Step 2: Creating Your First Dashboard (The Easy Way)
The fastest way to get started is by importing a pre-made dashboard template. The Robustel IIoT Starter Kit comes with a dashboard file specifically for the S6000U sensor.
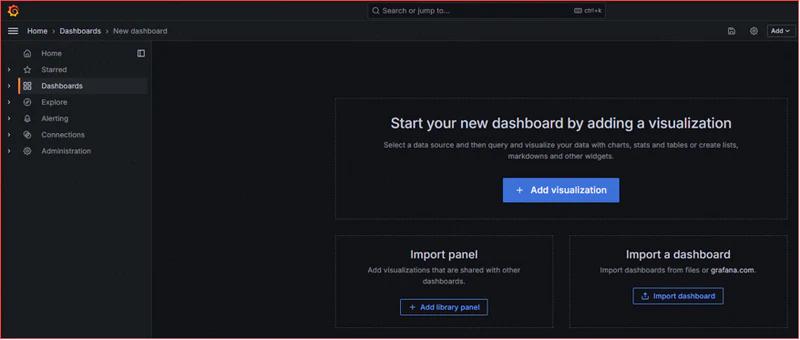
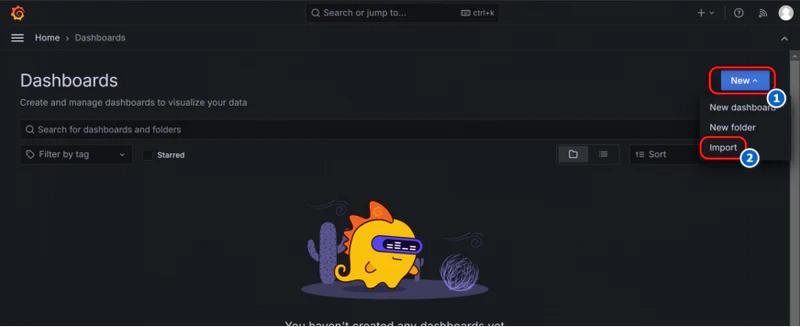
- In the Grafana interface, navigate to the Dashboards section.
- Click New and then select Import.
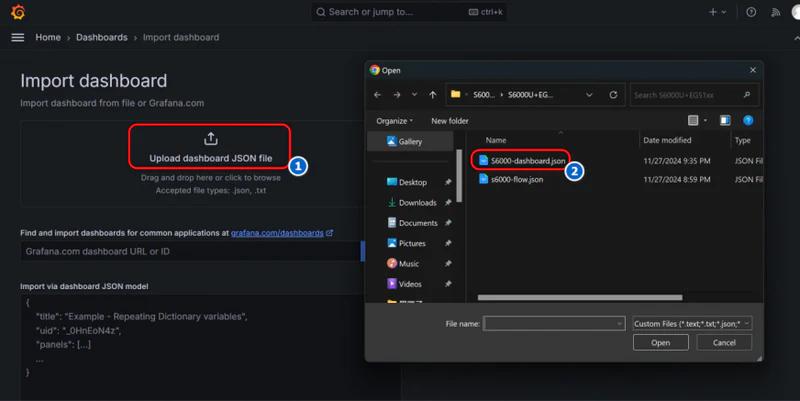
- Click Upload dashboard JSON file and select the S6000-dashboard.json file that comes with the starter kit.
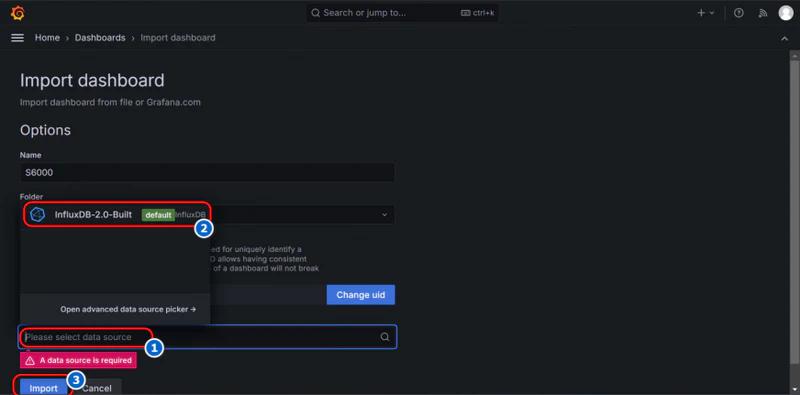
- After uploading the file, Grafana will ask you to select a data source. From the dropdown menu, choose the built-in InfluxDB data source.
- Click Import.
That’s it! Your dashboard will instantly come to life, populated with real-time data from your sensor.
You can contact support@robustel.com for inquiries regarding the S6000U–dashboard.json file
Step 3: Enhancing Your Dashboard with Plugins
One of Grafana’s most powerful features is its extensive library of plugins, which allow you to add new types of visualizations. The real ‘aha!’ moment for many users is realizing they can find a panel for almost any data type imaginable.
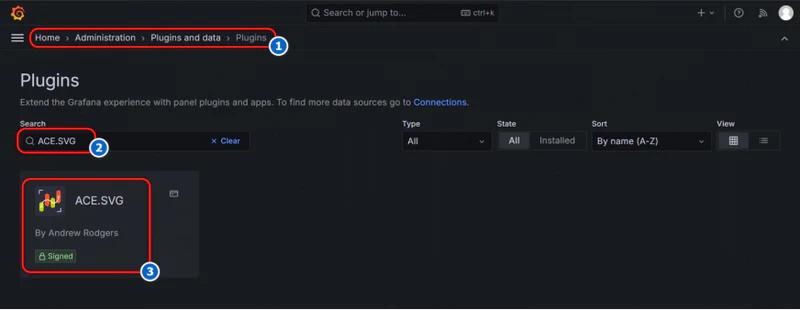
For example, the pre-built S6000U dashboard uses a special plugin to visualize the tilt sensor. To install it:
- In Grafana, navigate to Administration -> Plugins and data -> Plugins.
- Search for the plugin you need (e.g., ACE.SVG).
- Click Install.
Once installed, the new panel type will be available when you create or edit your Grafana IoT Dashboard.
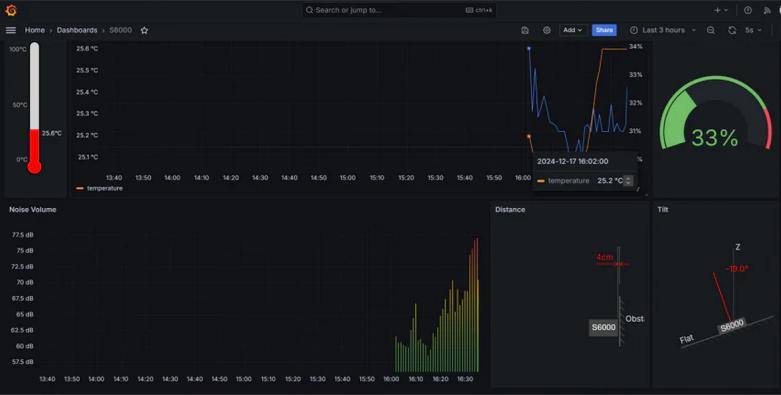
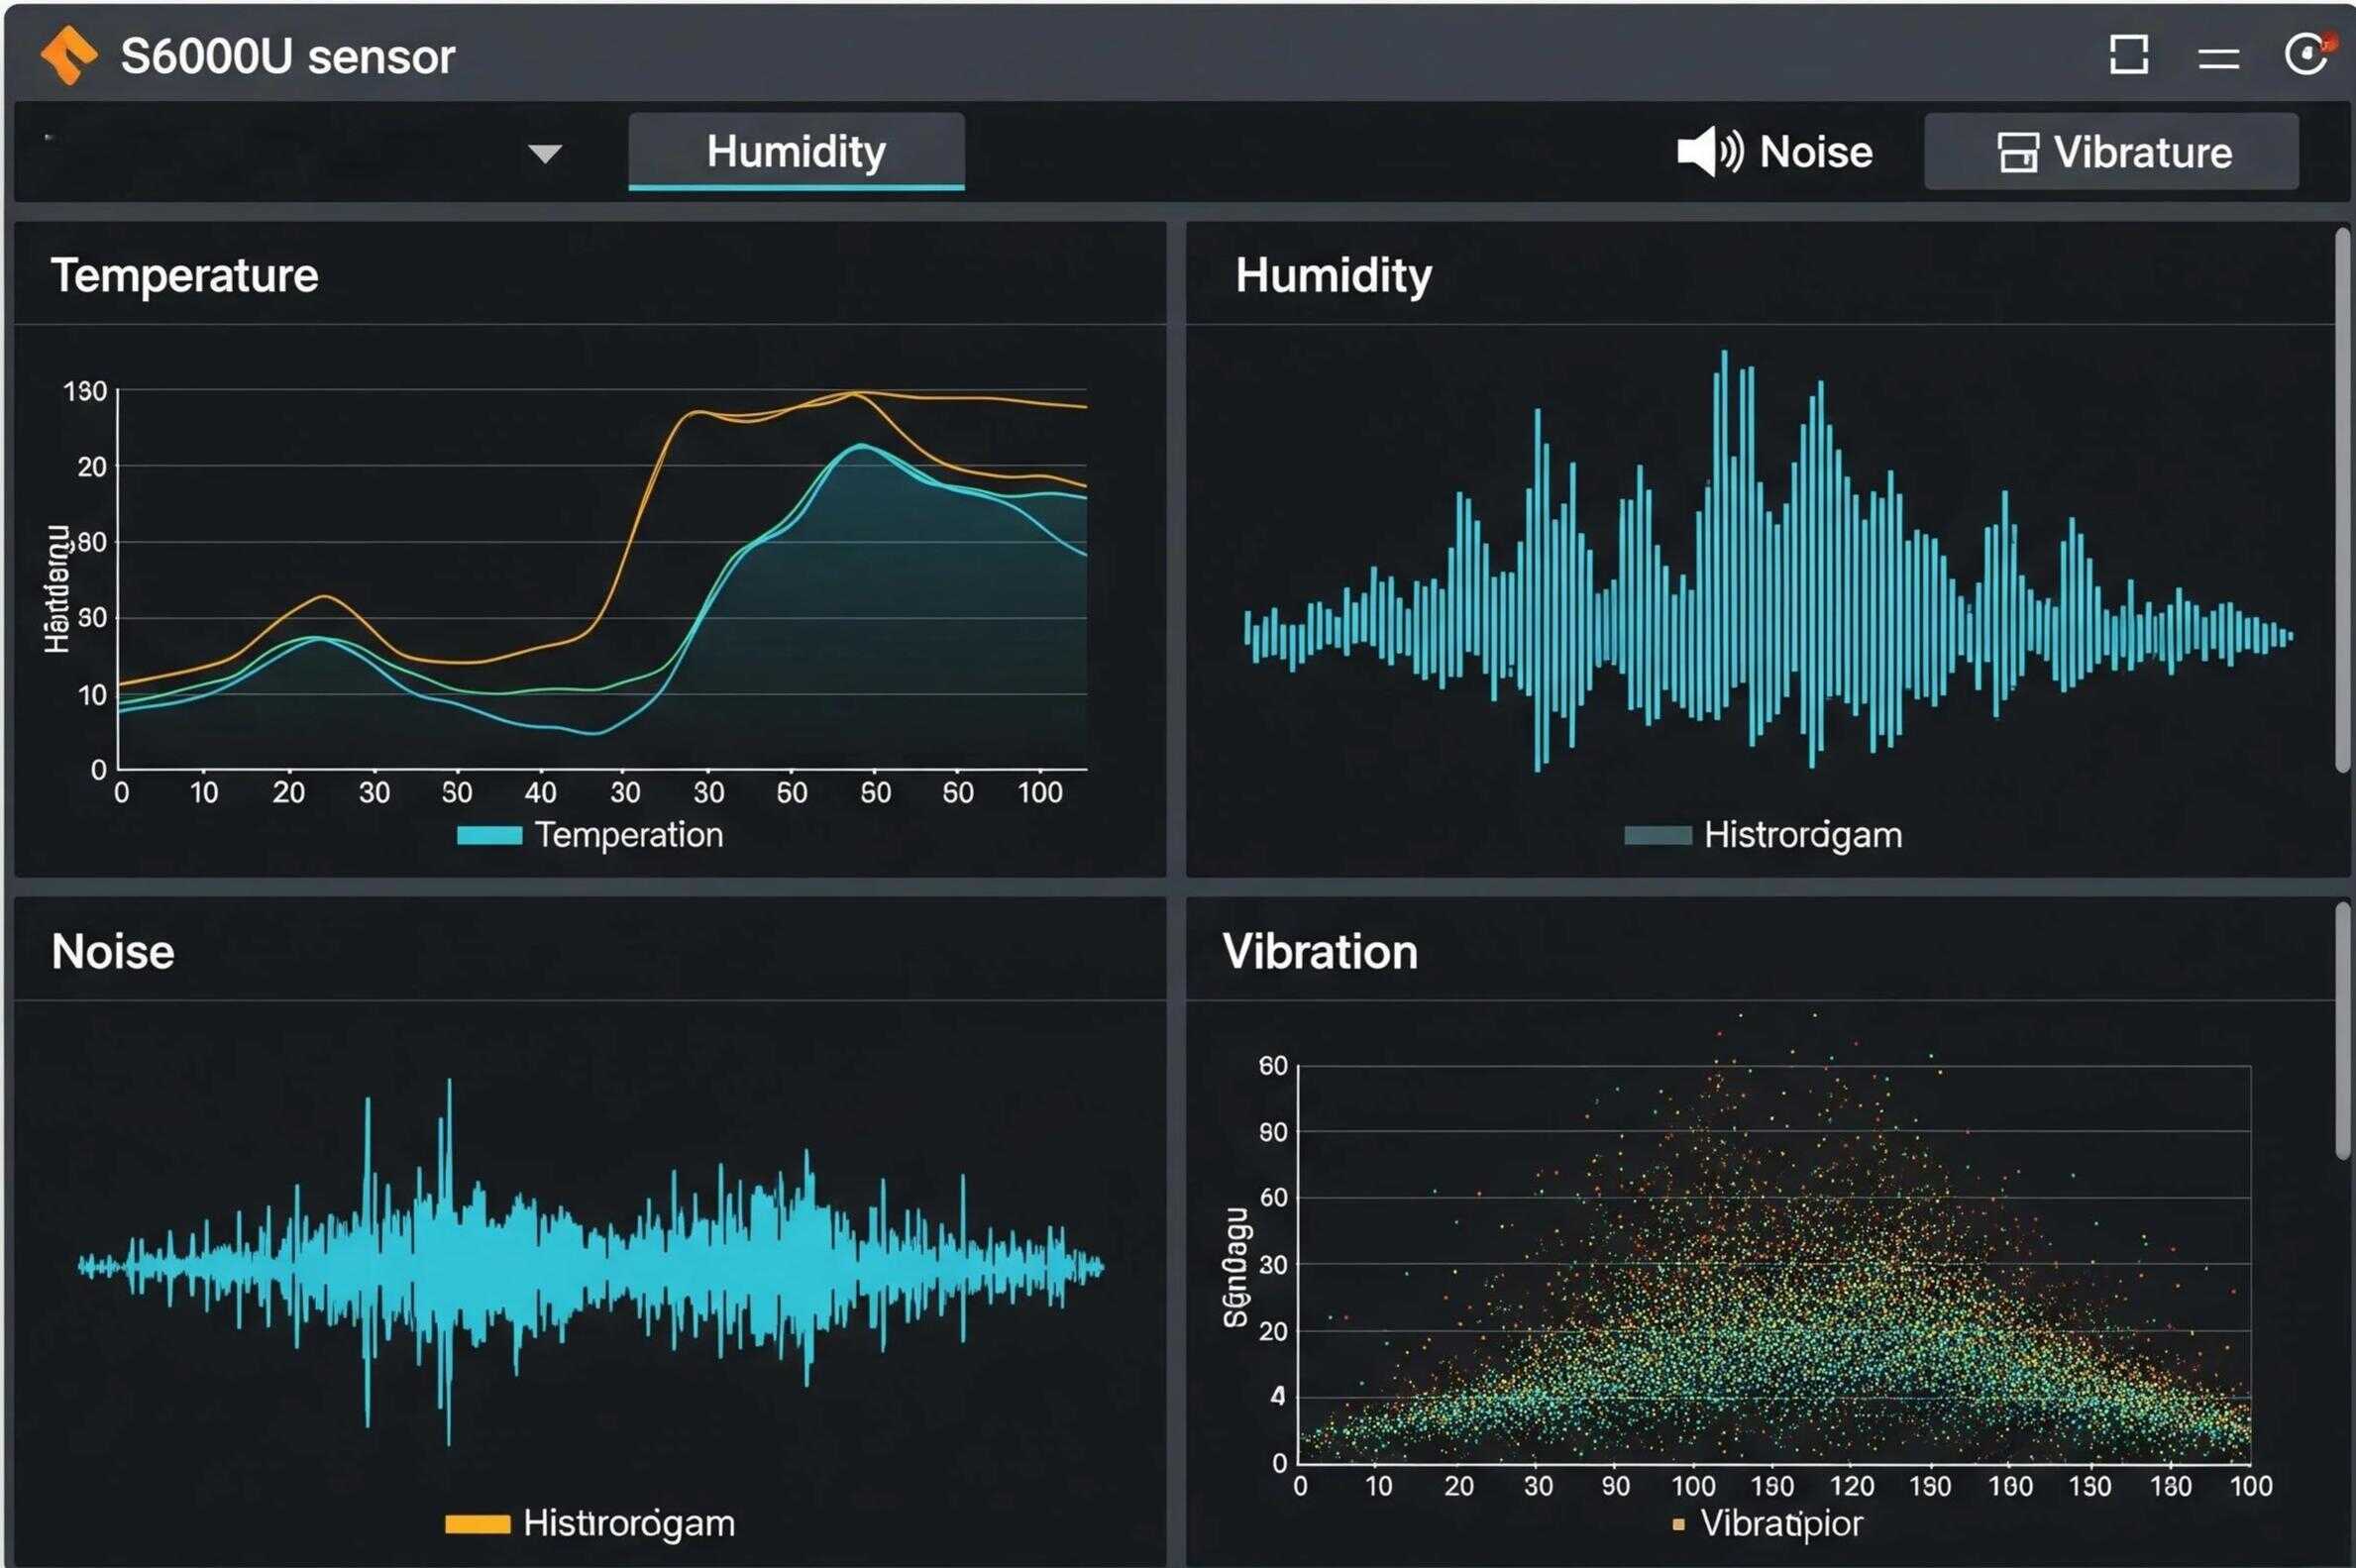
A well-designed Grafana IoT Dashboard transforms streams of numbers into immediate insights. The pre-built dashboard for the S6000U visualizes all seven of its sensor readings:
The Final Result: An Actionable View of Your Environment
- A temperature gauge.
- A humidity line graph.
- A noise volume bar chart.
- Vibration, distance, and tilt readings.
You now have a clear, at-a-glance understanding of your operational environment, powered entirely by your edge gateway
Conclusion: Empowering Edge Decisions with Visual Data
Powerful data visualization is no longer limited to expensive, cloud-only platforms. By running tools like Grafana and InfluxDB directly on a capable industrial IoT edge gateway—such as the Robustel EG5120—you can create professional, real-time dashboards right where your data is generated.
This edge-computing approach provides immediate insights, reduces dependency on external cloud services, and empowers you to make faster, more informed decisions based on your IIoT data.
The next step is yours: start experimenting with different data sources, create new panels, and build the custom dashboard that perfectly fits your application’s needs.
よくある質問
Q1: Do I need an internet connection to view my Grafana dashboard?
A1: No. Because Grafana and the InfluxDB database are running directly on your local EG5120 gateway, you can access the dashboard from any computer on the same local network, even if the gateway’s internet connection is down.
Q2: What is a time-series database and why is it important for a Grafana IoT Dashboard?
A2: A time-series database, like InfluxDB, is specifically designed to efficiently store and retrieve data with a timestamp, like sensor readings. Grafana is a visualization tool that excels at creating graphs and dashboards from this type of data, making them a perfect pair for any IoT application.
Q3: Can I create my own custom panels in Grafana?
A3: Absolutely. After importing the initial dashboard, you can easily add, remove, and configure panels. You can choose from dozens of built-in panel types (like graphs, gauges, tables, and bar charts) and connect each one to a specific data metric from your InfluxDB database.
著者について
ロバート・リャオ |テクニカルサポートエンジニア
ロバート・リャオロバステルIoTテクニカルサポートエンジニアであり、産業用ネットワークとエッジ接続を専門とする。認定ネットワークエンジニアであるロバートは、大規模IIoTインフラの展開とトラブルシューティングに注力している。彼の業務は、複雑な産業アプリケーション向けに信頼性が高くスケーラブルなシステム性能を設計し、現場のハードウェアとクラウド側のデータ管理の間のギャップを埋めることに重点を置いている。