
Edge Gateway Observability: Logs, Metrics and Remote Debugging for Containers
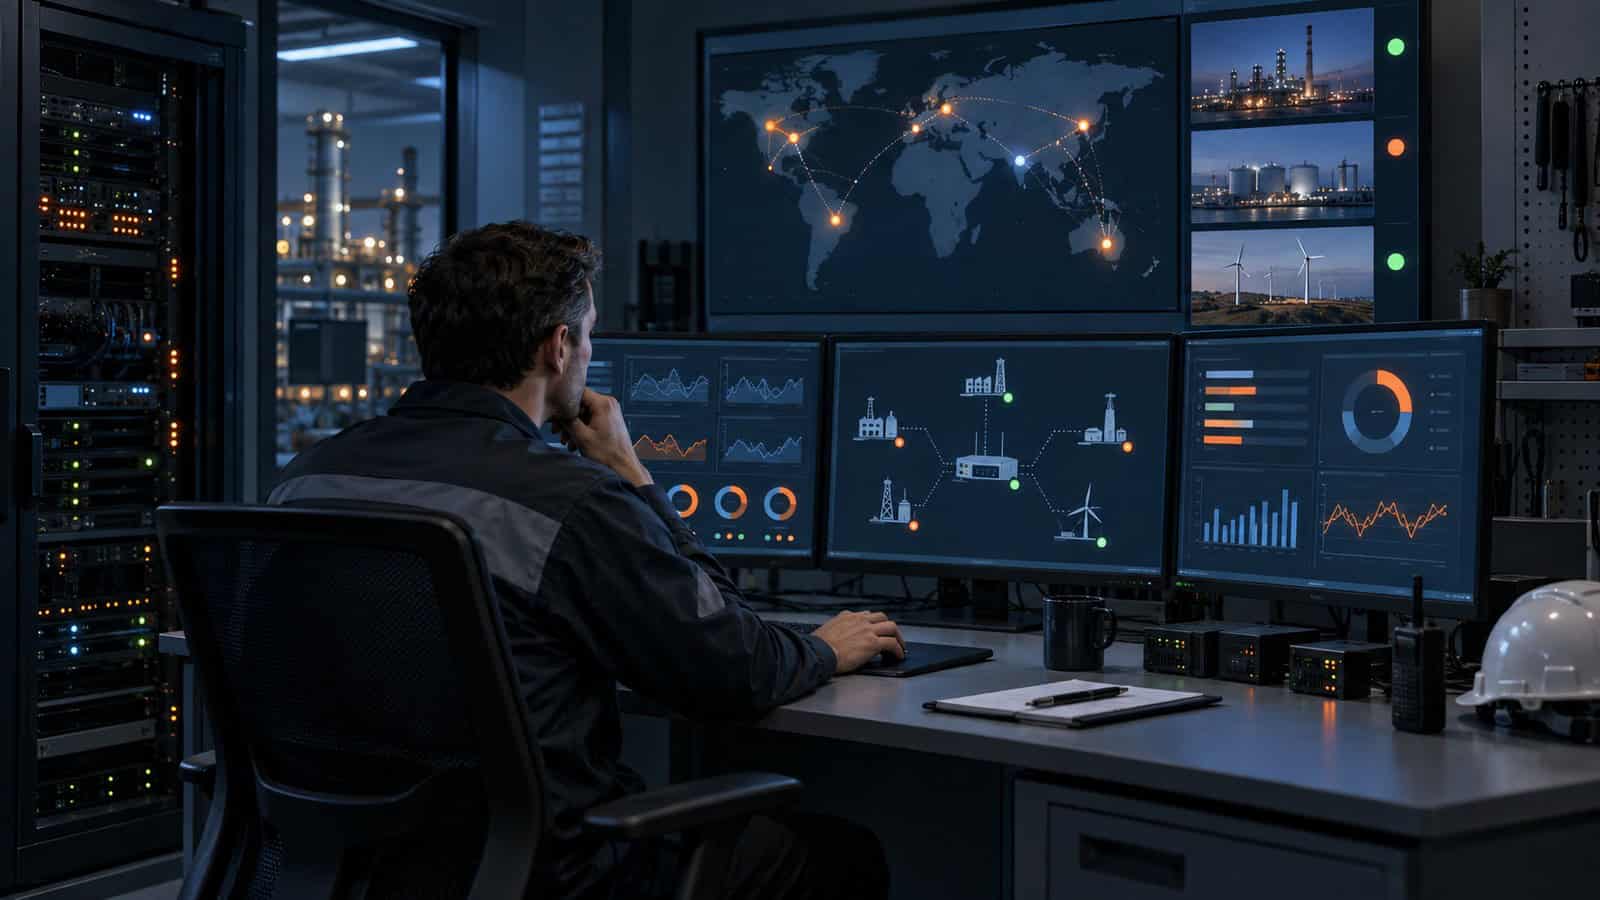
The Robustel EG5120 Edge Computing Gateway combines Docker-capable local compute, industrial interfaces, cellular connectivity and RCMS fleet management, giving operations several places to observe a distributed application. The monitoring design should answer one practical question: is the incident in the gateway, container, field-data path, WAN or upstream service?
Begin with the Question the Incident Must Answer
A dashboard can look complete while still failing during the incident it was meant to explain. My test is whether the retained evidence can identify the failing layer after the WAN is removed, the container restarts or storage pressure rises. If the answer depends on opening an interactive remote session, the observability design is still relying on access rather than evidence.
Collecting every log is expensive and often less useful than selecting evidence around known failure paths. For each service, define the user-visible symptom, the owning layer and the minimum telemetry needed to decide the next action.
| Symptom | First metrics | Logs or evidence | Likely owner |
|---|---|---|---|
| No field data | Interface errors, poll success, input rate | Driver/protocol events and device identity | OT integration |
| Container restarting | Restart count, exit status, memory | Application stderr and runtime events | Application team |
| Cloud gap | Queue depth, WAN state, publish errors | DNS, TLS and broker/client events | Network or platform |
| Slow local result | CPU, memory, storage latency, input rate | Processing-stage timings | Application/performance |
| Site unreachable | Router power, registration, signal, last contact | RCMS/network events | Fleet/network operations |
Robustel’s Public Safety CCTV Application Example using the EG5100 illustrates separate camera, local edge and remote-access paths. That separation is valuable for incident maps, although the example does not establish EG5120 telemetry or camera capacity.
Logs Need Retention Rules, Not Unlimited Volume
Set retention and rotation by severity and operational use. Debug logging left permanently enabled can consume storage and obscure the events that matter. Include timestamps with timezone, application and container version, stable site identity and a correlation identifier where the data path supports it.
Keep credentials, tokens and personal data out of logs. If a diagnostic bundle leaves the site, define who can request it, how it is protected and when it is deleted.
Container Health Is Only Half the System
A healthy process is not necessarily a healthy service. Container health should test a meaningful local function, while host monitoring covers CPU, memory, storage, temperature where exposed, interface state and time synchronisation. Watch restart count and resource trends rather than only current values.
The Robustel’s EG5120 quick-start video helps operations recognise the deployment context before application-specific instrumentation is added. It is not a container observability specification.
Use a layered release checklist:
- identify the exact host and application version in every event;
- expose a functional health check, not only process existence;
- alarm on sustained resource pressure and restart loops;
- retain enough local evidence to explain a WAN outage;
- verify clock and log rotation under the production write rate; and
- rehearse export and redaction of an incident bundle.
Distributed Observability on the Robustel EG5120 Edge Computing Gateway
Robustel EG5120 edge computing gateway offers a quad-core ARM CPU, 2 GB or 4 GB RAM variants, 64 GB eMMC, Docker on RobustOS Pro, Gigabit Ethernet, serial and digital interfaces, dual SIM and 4G or 5G options. RCMS supports device monitoring, configuration and managed fleet operations.
That combination allows the host, network and application layers to be observed without sending every raw event continuously to the cloud. The project still needs to instrument its own container and field-data logic. RCMS visibility does not prove that a decoded value is correct or that a custom application is healthy.
For deployments on Robustel EG5120, E2C Factory can add supported local visualisation, alarms, workflows and data-operation functions beside the gateway’s compute and connectivity. Used together, the pairing can give operations a clearer path from machine data to local status and northbound delivery than a black-box container alone. Exact tags, protocols and responses remain part of the application design.
| Observability layer | EG5120/platform role | Application-owner role |
|---|---|---|
| Device and WAN | Gateway and RCMS status | Correlate with service symptoms |
| Host resources | OS/container runtime evidence | Define thresholds from benchmark |
| Application | Runtime and deployment environment | Emit health, errors and version context |
| Field data | Industrial interfaces | Validate identity, quality and semantics |
| Upstream delivery | Network path and local queues | Track acknowledgement and replay state |
Remote Debugging Should Be an Exception Path
Robustel’s Secure Remote Access to Industrial Robots Application Example presents remote service as an access architecture rather than a direct extension of the engineer’s laptop. Apply that principle to container debugging: authenticate, limit the target, record the session and avoid permanent privileged access. The example does not prove a specific debugging tool on EG5120.
Prefer diagnostic commands and read-only evidence before opening an interactive shell. If a live change is necessary, capture the reason, operator, command or package version and rollback. Close the path when the incident ends.
The Evidence Must Survive the Failure
Disconnect the WAN, exhaust a test queue safely, crash a container, fill a bounded test volume and feed malformed field data in controlled conditions. Confirm the alert points to the right owner and that useful evidence survives the event. Monitoring that disappears with the cloud connection is incomplete for a remote edge estate.
FAQs
Q1. What should be monitored on an edge gateway?
Monitor device reachability, WAN state, CPU, memory, storage, time, interfaces, container health, restart count, data flow and upstream delivery. Select thresholds from the production workload rather than generic percentages alone.
Q2. How do you monitor Docker containers at the edge?
Combine runtime state and resource metrics with an application-level health check. Include image version, restart history and bounded logs so a replacement or rollback can be traced.
Q3. Should edge logs be stored locally or in the cloud?
Usually both roles are useful: local retention preserves evidence during WAN loss, while central collection supports fleet comparison. Define capacity, redaction, transfer and deletion for each log class.
Q4. How can remote debugging be secured?
Use authenticated, authorised and time-bounded access to a named device, log the session and prefer least-privilege diagnostic actions. Remove temporary credentials and access paths after the incident.
Q5. What observability does the Robustel EG5120 Edge Computing Gateway provide?
It provides a managed gateway and Docker-capable host with RCMS fleet visibility, network status and configuration operations. Custom containers still need their own functional health, logs, metrics and incident context.
Conclusion
The Robustel EG5120 Edge Computing Gateway suits distributed edge applications where host, network and application evidence must be collected within one operating model. The platform choice is justified when that evidence remains available during the failure being investigated.
Create controlled WAN, container and storage faults before rollout. If the retained records identify the failing layer and support a safe recovery without routine interactive access, the observability design is doing its job.
Explore More Articles About Robustel Edge Computing Gateways


About the Author
Robert Liao | Technical Support Engineer
Robert is an IoT Technical Support Engineer at Robustel, specializing in industrial networking and edge connectivity. A certified Networking Engineer, Robert focuses on the deployment and troubleshooting of large-scale IIoT infrastructures. His work centers on architecting reliable, scalable system performance for complex industrial applications, bridging the gap between field hardware and cloud-side data management.